User Guide: Coretime Price Simulator
Introduction
This guide will walk you through the features and functionalities of the simulator, ensuring you make the most out of this application. For a video guide check out this youtube video:
Visualization
The Coretime Price Simulator provides a graphical representation of sale prices over time based on your input settings. Key periods, such as Interlude, Leadin, and Region, are distinctly marked on the graph for clarity.
Sidebar: Customizing Your Simulation
The sidebar is your control panel for customizing the simulation. It contains various settings that directly influence the graph's output.
Hovering over the ? icon next to each setting reveals additional information.
Configuration Settings
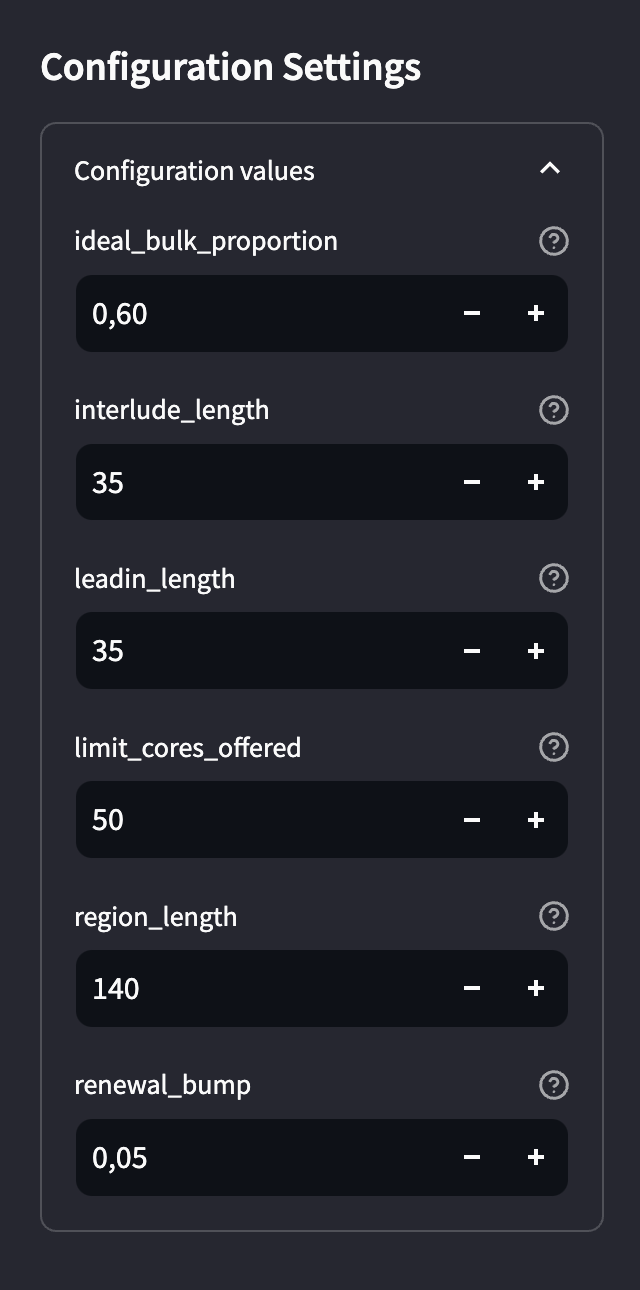
In the 'Configuration Settings' section, sliders allow you to adjust various parameters that influence Coretime pricing:
- Ideal Bulk Proportion: Sets the target ratio of cores for stable pricing. Prices rise if
cores_soldexceed this proportion. - Interlude Length: Defines the renewal period, giving precedence to existing tasks.
- Leadin Length: Duration of dynamic pricing phase where prices gradually decrease to the sale price, reflecting market demand.
- Limit Cores Offered: Maximum number of cores available per sale, crucial for maintaining market balance.
- Region Length: Time span of core allocation for each sale, indicative of the bulk period in Agile Coretime.
- Renewal Bump: Incremental price increase for renewals, facilitating long-term budgeting.
Sale Settings
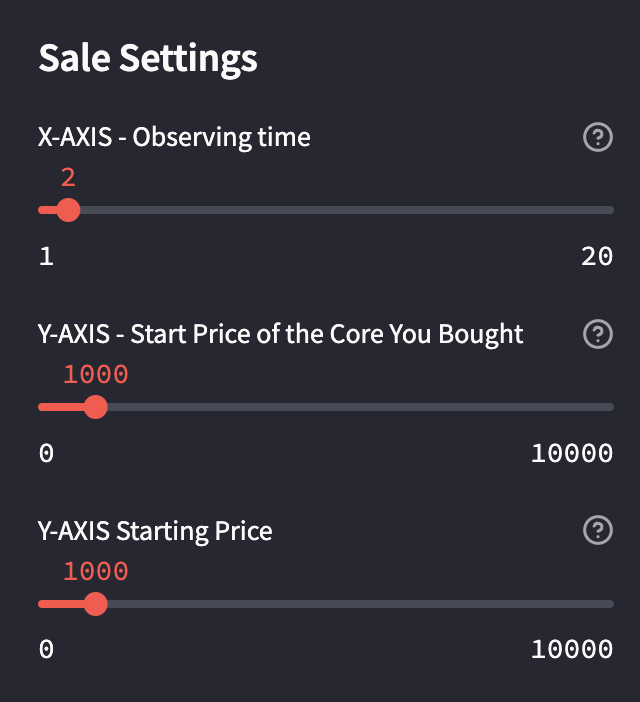
Adjust the sale settings to specify the time frame and initial pricing for your simulation.
- Observation Time: Use the 'X-AXIS - Observing time' slider to select the number of regions to observe.
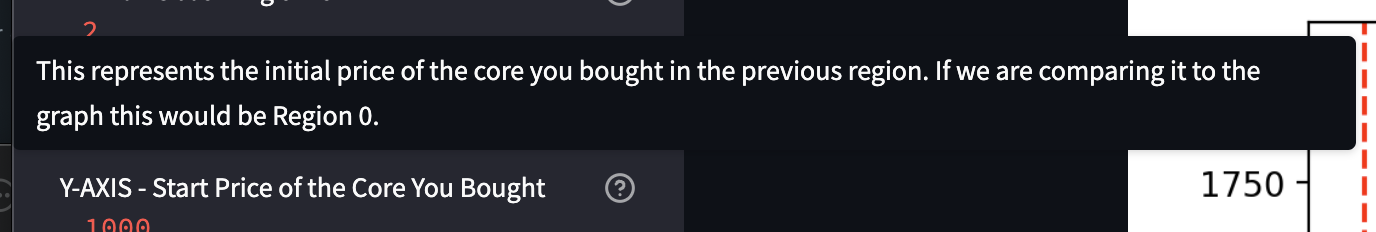
- Initial Core Pricing: Determine starting prices for cores with the 'Y-AXIS' sliders.
Core Sales Configuration
Customize your sale model:
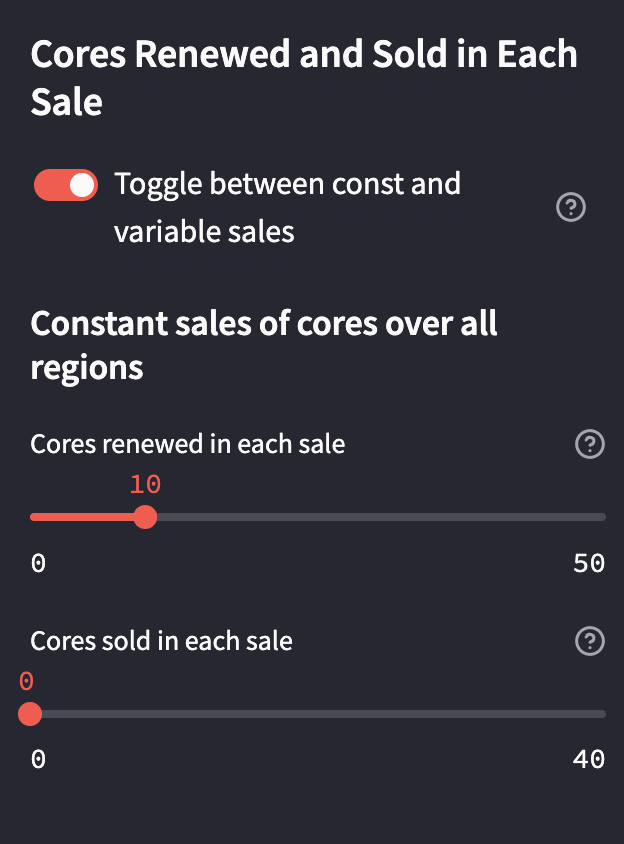
- Constant Sales: Set a uniform number of cores renewed and sold in each sale.
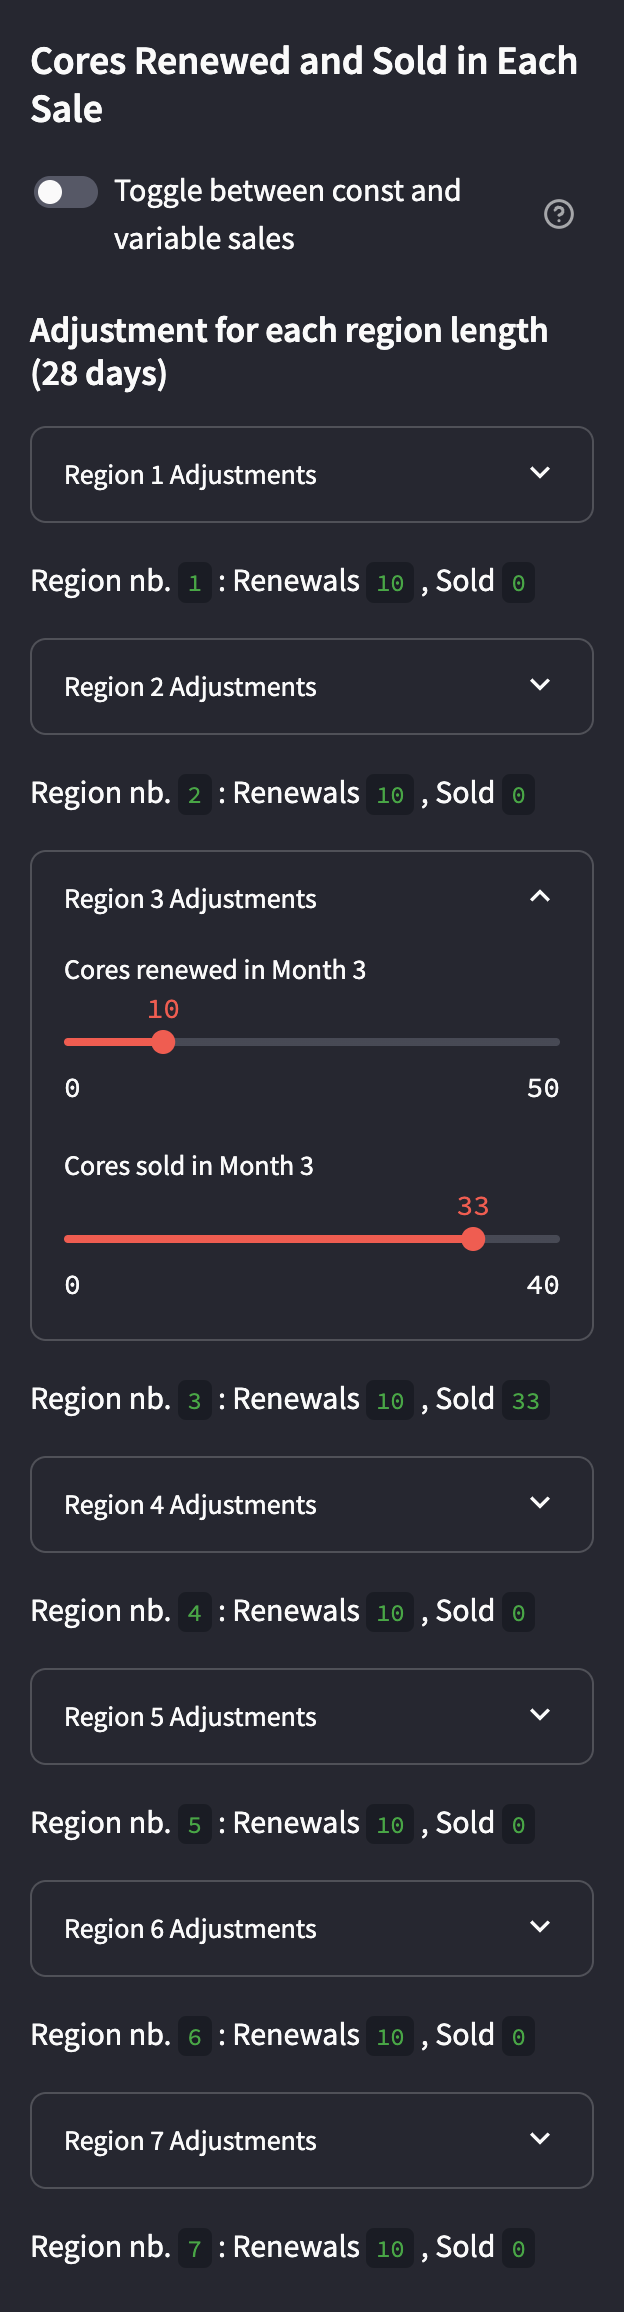
- Variable Sales: Modify the number of cores renewed and sold for each region, reflecting a dynamic market model.
For constant sales:
For variable sales:
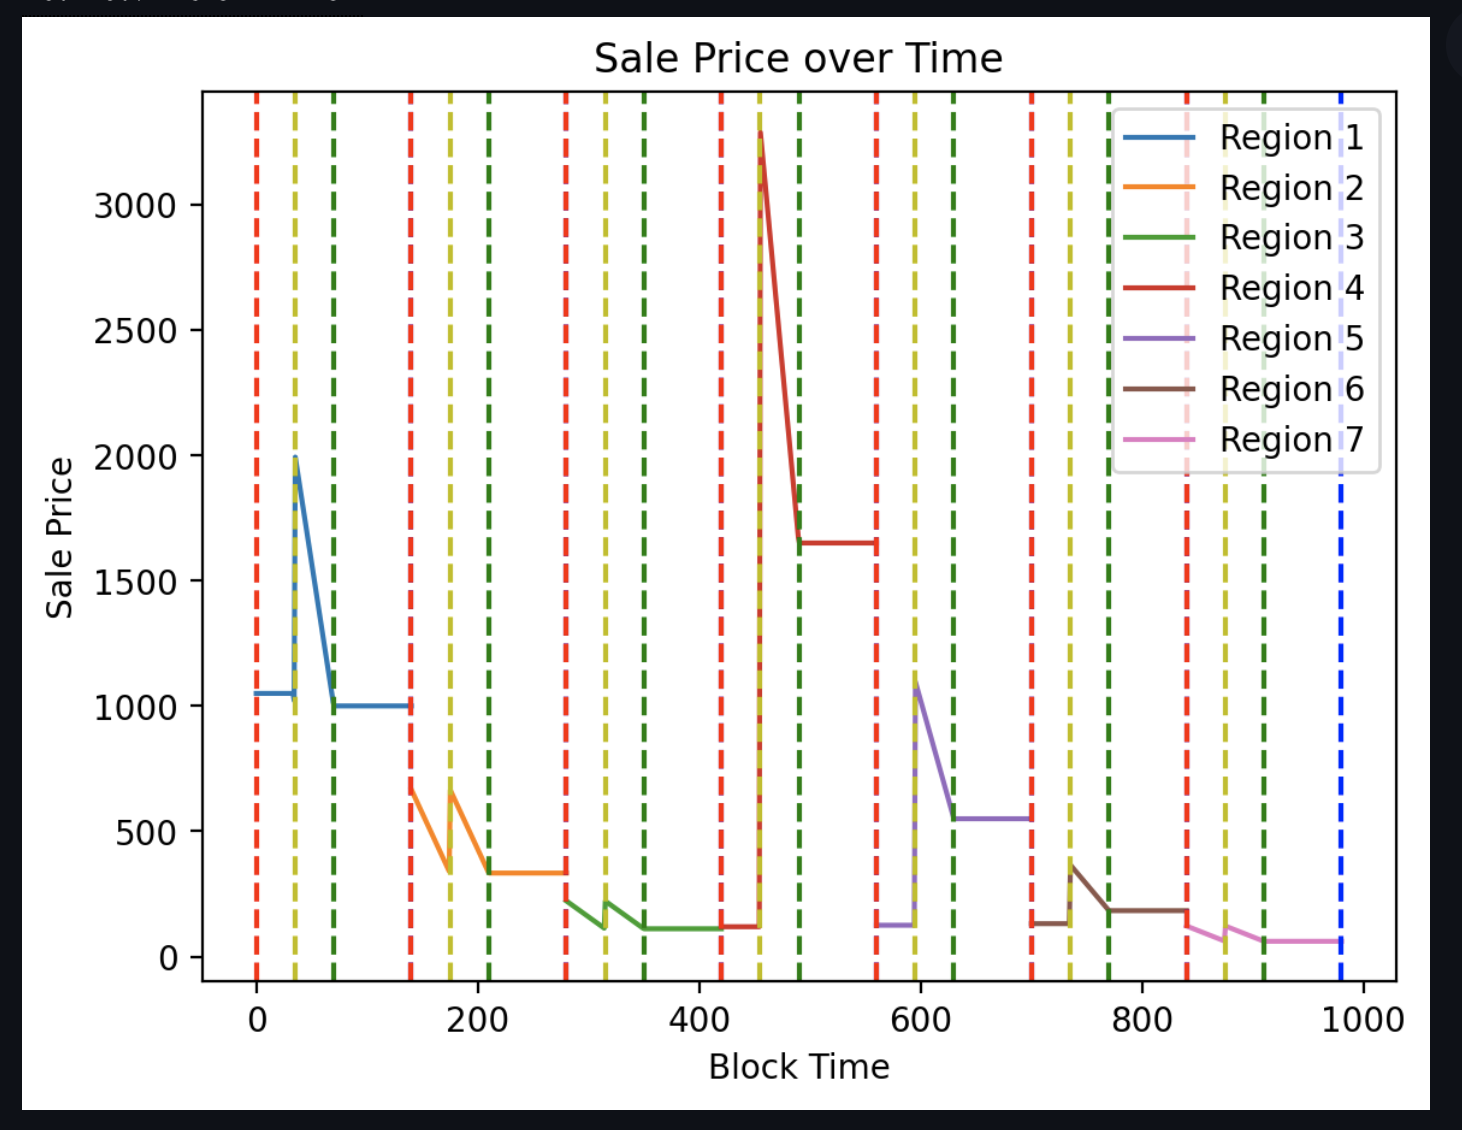
The graph for variable sales that coresponds to above settings will look like this:
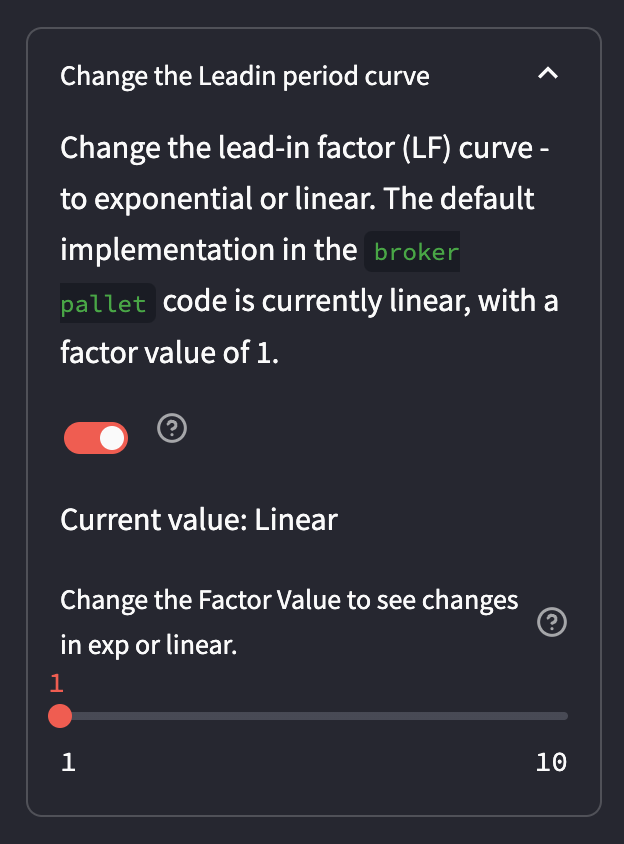
Additional Feature: Leadin Period Curve
A unique feature of our simulator is the ability to modify the Leadin period curve. This lets you explore how linear or exponential pricing models impact Coretime prices.